Hatching, Hachures, and Contour Lines - Shaded Reliefs for Pen Plotter Maps
25 Apr 2025In mapmaking, one of the oldest problems is finding a visually pleasing way to represent elevation using just two dimensions (or as Edward Tufte would call it: trying to escape flatland).
Websites like shadedrelief.com, shadedreliefarchive.com, and reliefshading.com list map examples for good terrain and bathymetry (ocean depth) representations, but (almost all) of the modern techniques are designed for pixel-based printing techniques1.
Historically it was necessary to engrave or etch dots and lines in a metal plate for printing. When working with pen plotters, lines are the geometry of choice so it makes sense to spend some time with the historical methods:
Contour Lines
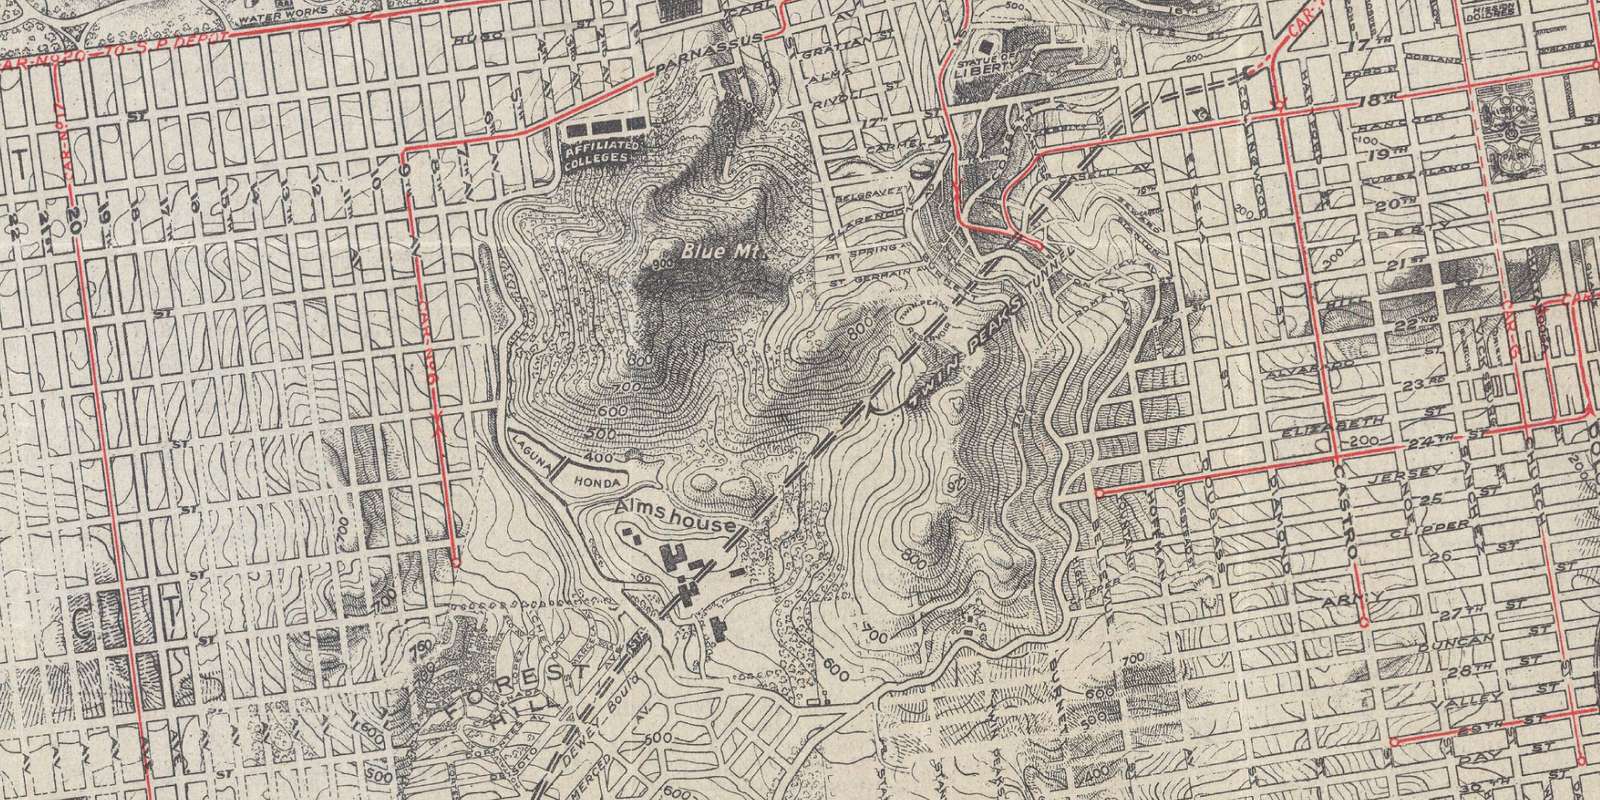
Contour lines (lines representing an elevation slice, crossing the slope direction at a 90-degree angle) are probably the most common method of representing terrain on maps.
The closer to each other the contour lines run, the darker the map appears. Thus, any dark areas indicate the steep slopes, not a shadow which should create some perception of depth. To convey some sense of shading, hatching or hachure lines are used on top of contour lines, as in this tourist map of San Francisco:
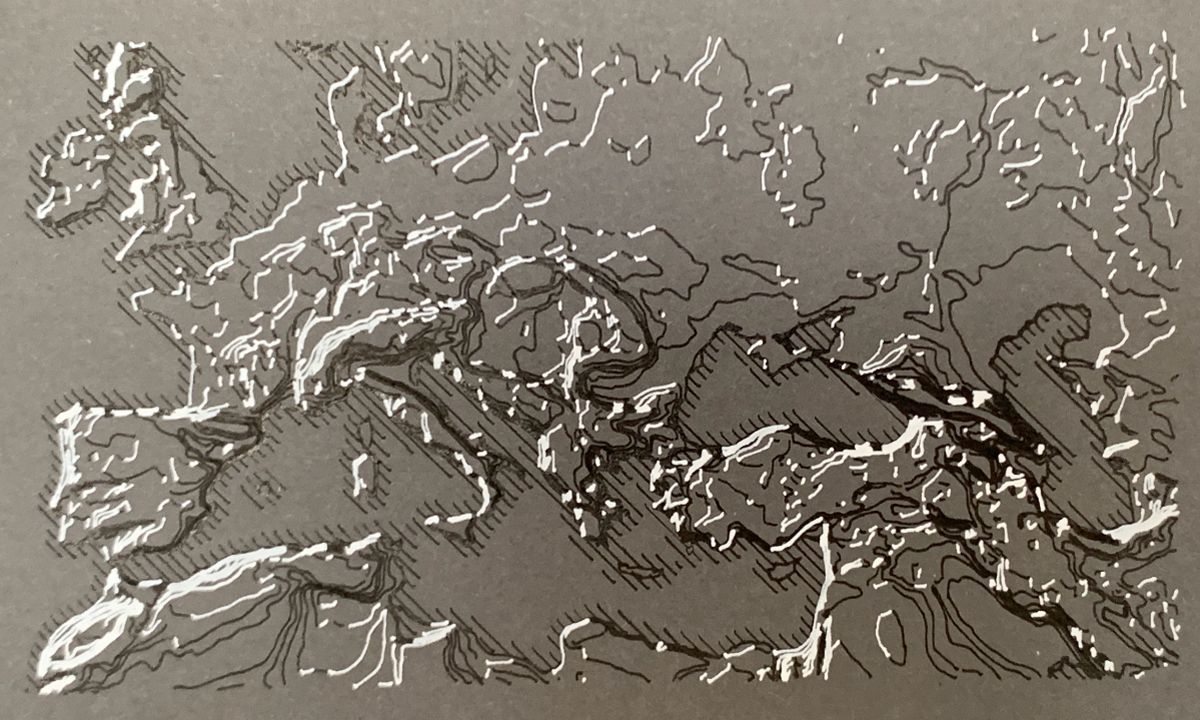
However, there is a notable improvement on the classic contour lines called illuminated contours or Tanaka contours2. Creating the visual effect of a relief by using a lighter color for raised line segments perpendicular to the direction of a simulated sun.
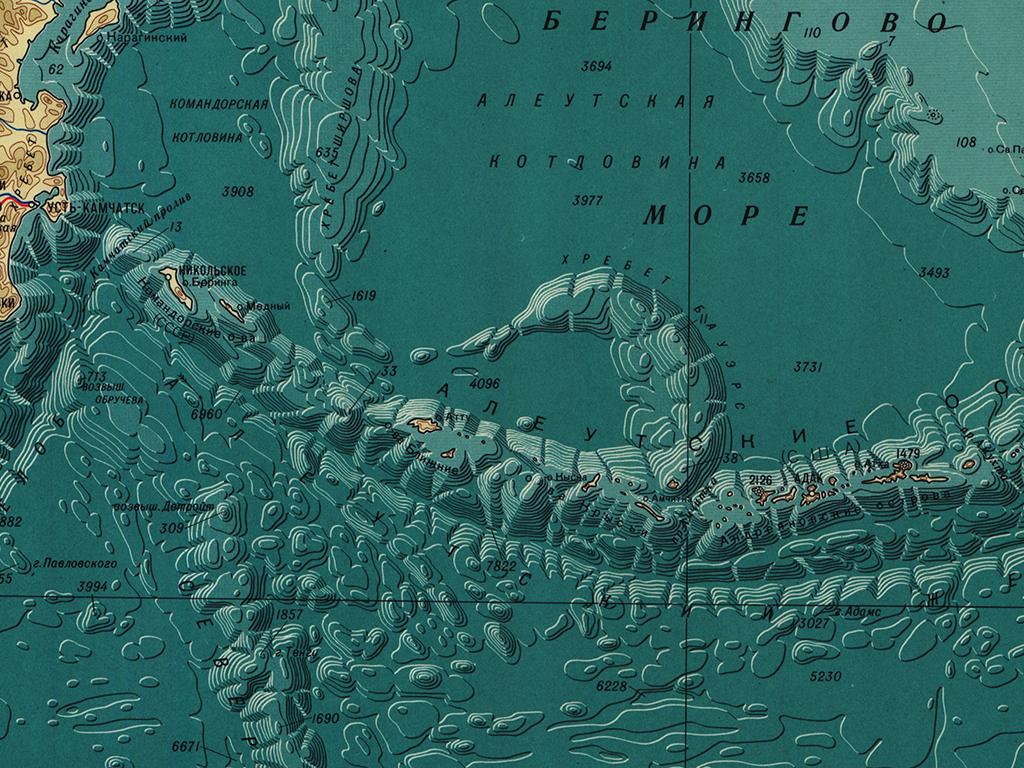
Source: Tweet by Daniel P. Huffmann
This can be combined with variations in line thickness and other tricks (papers linked below).
The illuminated contours effect works best with rather large geographical features, I had some issues with small and detailed segments:
Links:
- GIS Applications to Historical Cartographic Methods to Improve the Understanding and Visualization of Contours, paper by Patrick Kennelly
- Modifications of Tanaka’s Illuminated Contour Method, paper by Patrick Kennely and A. Jon Kimerling
- How to create Tanaka contours in QGIS, blog post by Evelyn Uuemaa
- How to create illuminated contours, Tanaka-style, blog post by Anita Graser
- Cartographic Relief Presentation, book by Eduard Imhof (the cover features a Tanaka contour)
Hachures
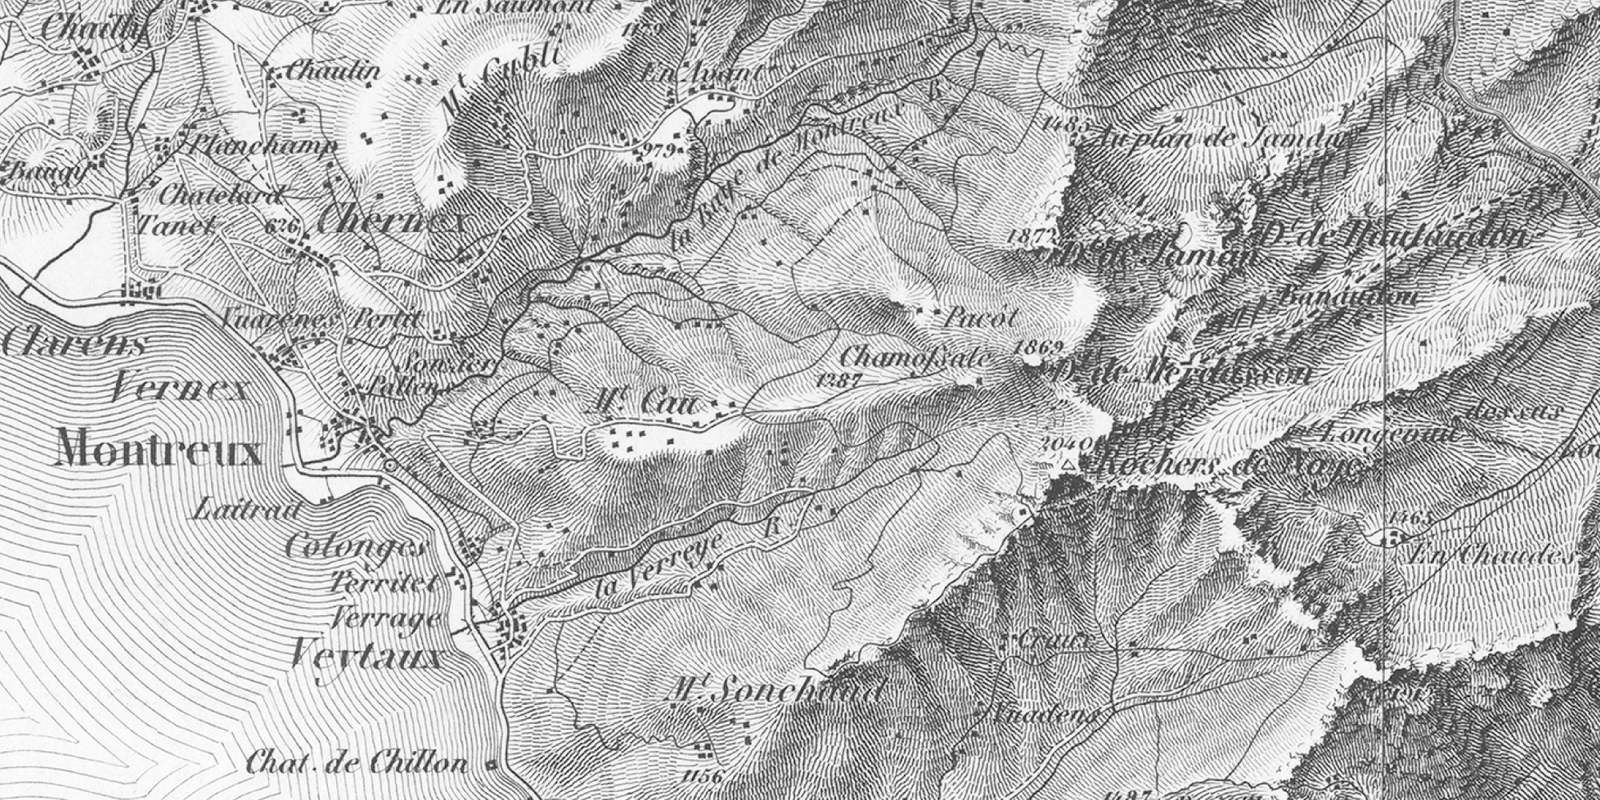
Hachures on hachure maps are hatching-like lines along the elevation direction first standardized in 1799. The most prominent example are the Swiss topographic maps, also called Dufour Maps:
These hachures can be visually pleasing, as seen in this crop from the Admiralty Chart No 1854 Azores San Miguel, Published 1849:
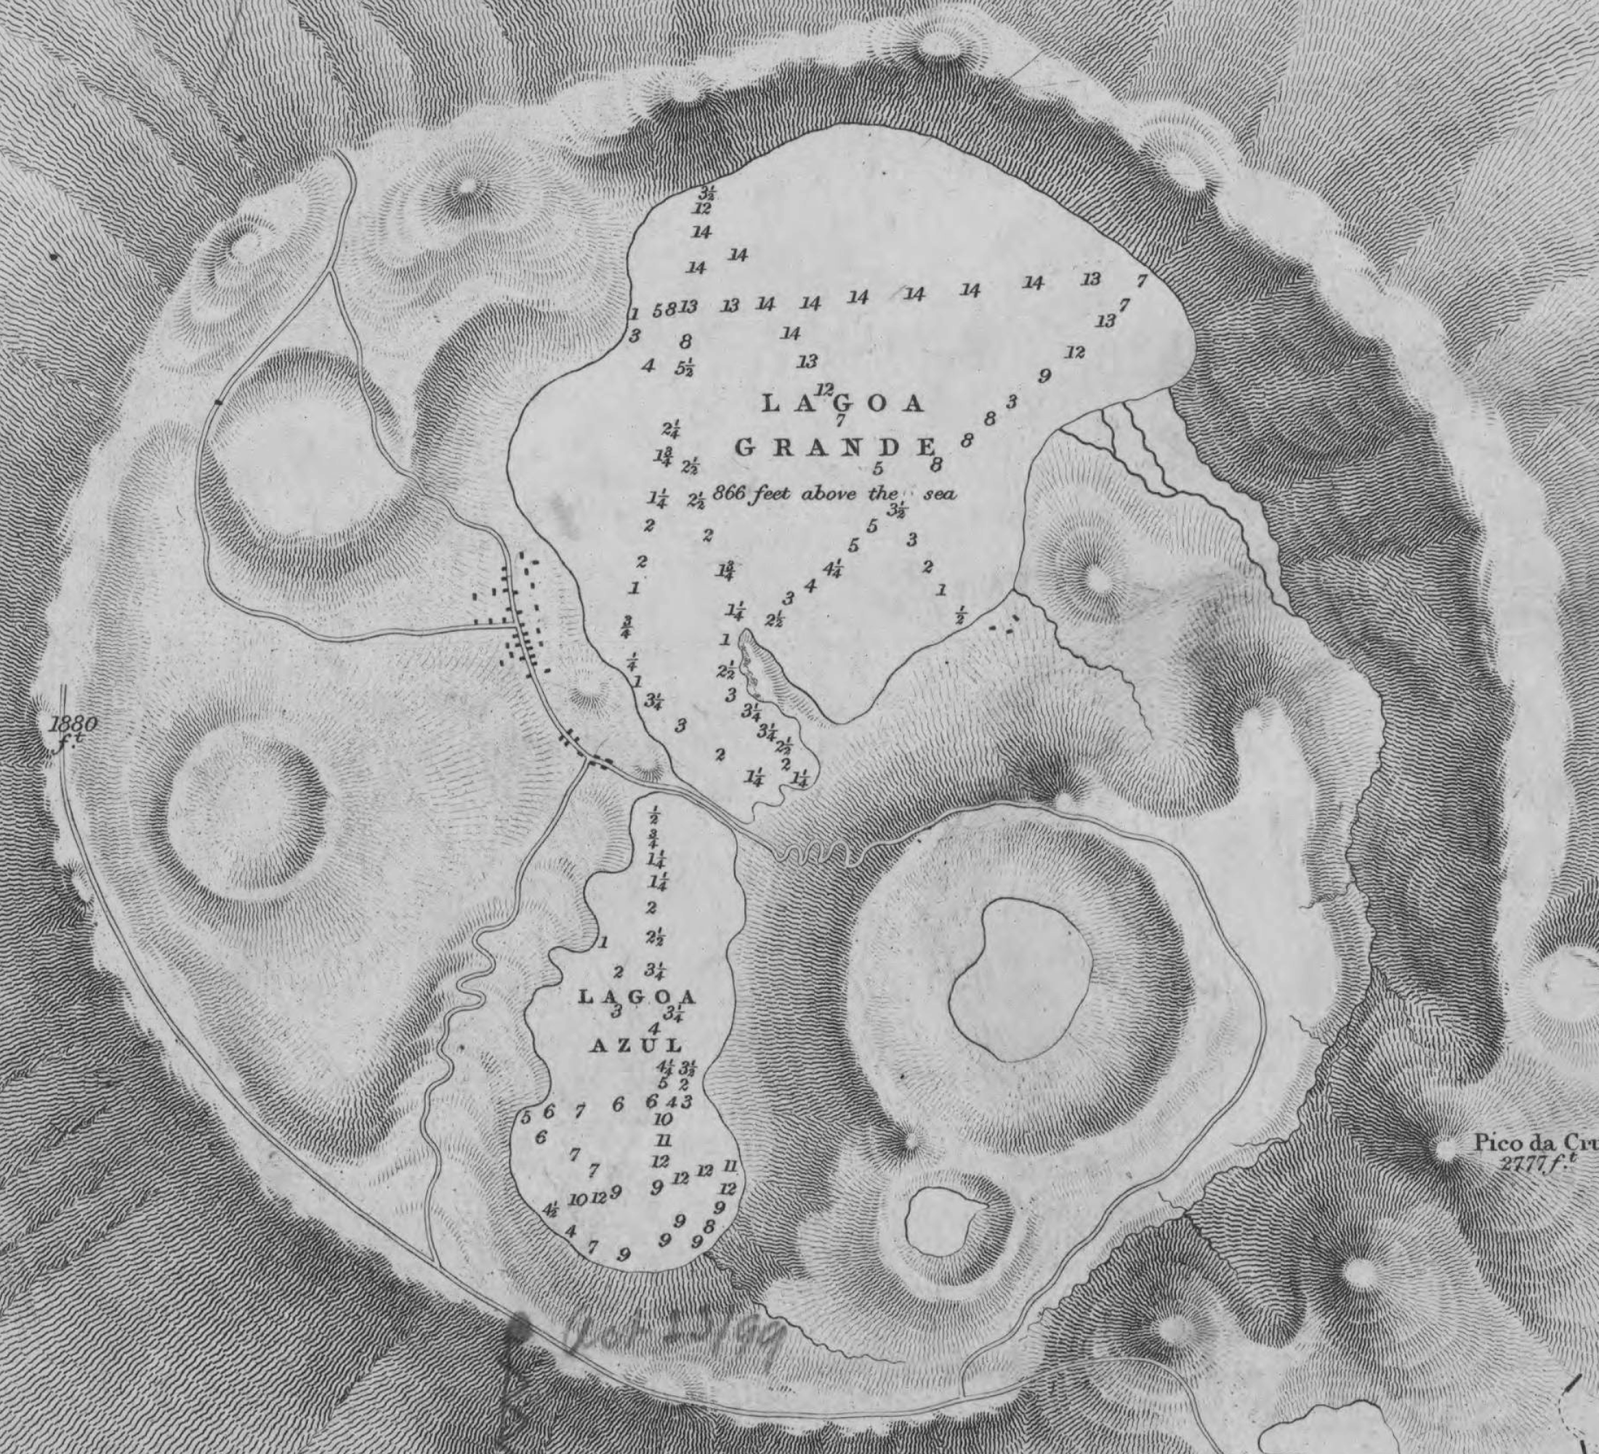
For complicated geographies, the hachures act like a grayscale dithering filter:
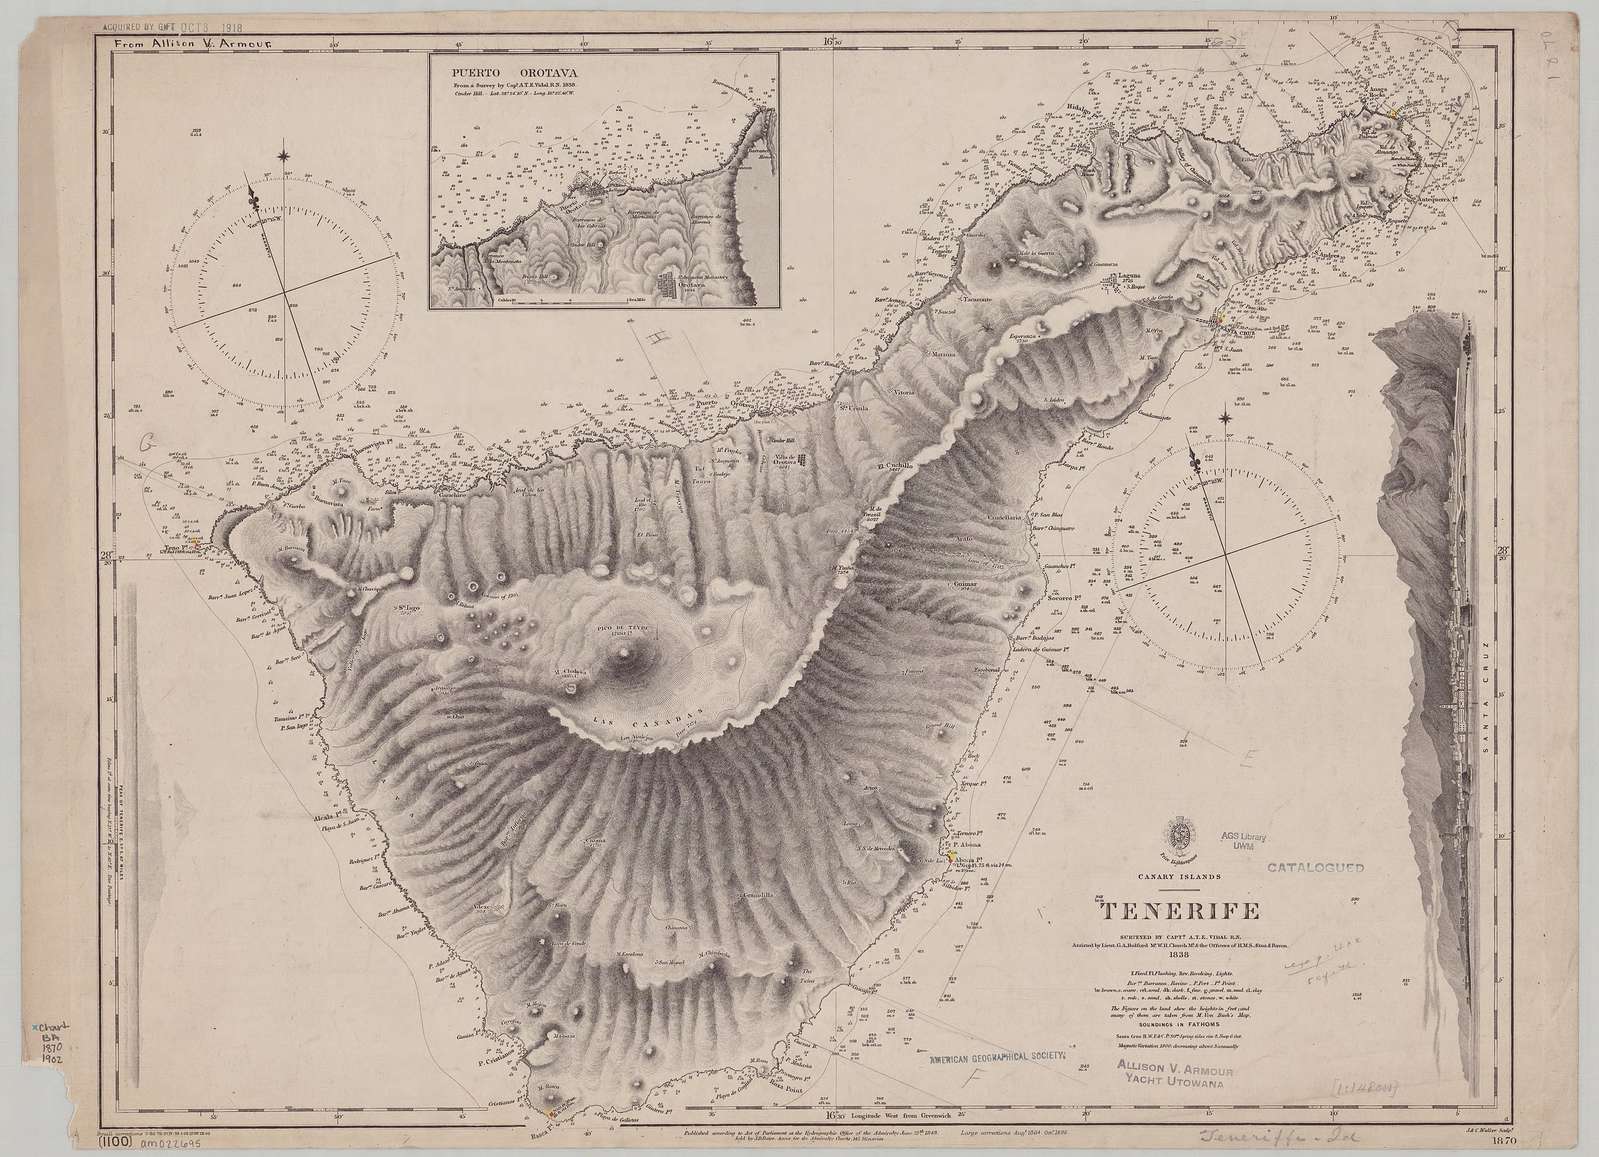 Admiralty Chart No 1870c Tenerife, Published 1848
There are some proposals on how to automate these hand-drawn/carved hachure lines from historical copperplate prints for modern computer-generated maps:
- Hachure lines with QGIS, blog post by Robin Hawkes
- Morphometric Mapping of Topography by Flowline Hachures , paper by Timofey Samsonov
Hatching & Other Techniques
Regular Hatching
Parallel lines in a fixed angle with varying distances. That’s what I used for my giant wall map:
 Sometimes historical maps do not use parallel lines but make use of shrinking outlines, especially for coastlines:
Combinations
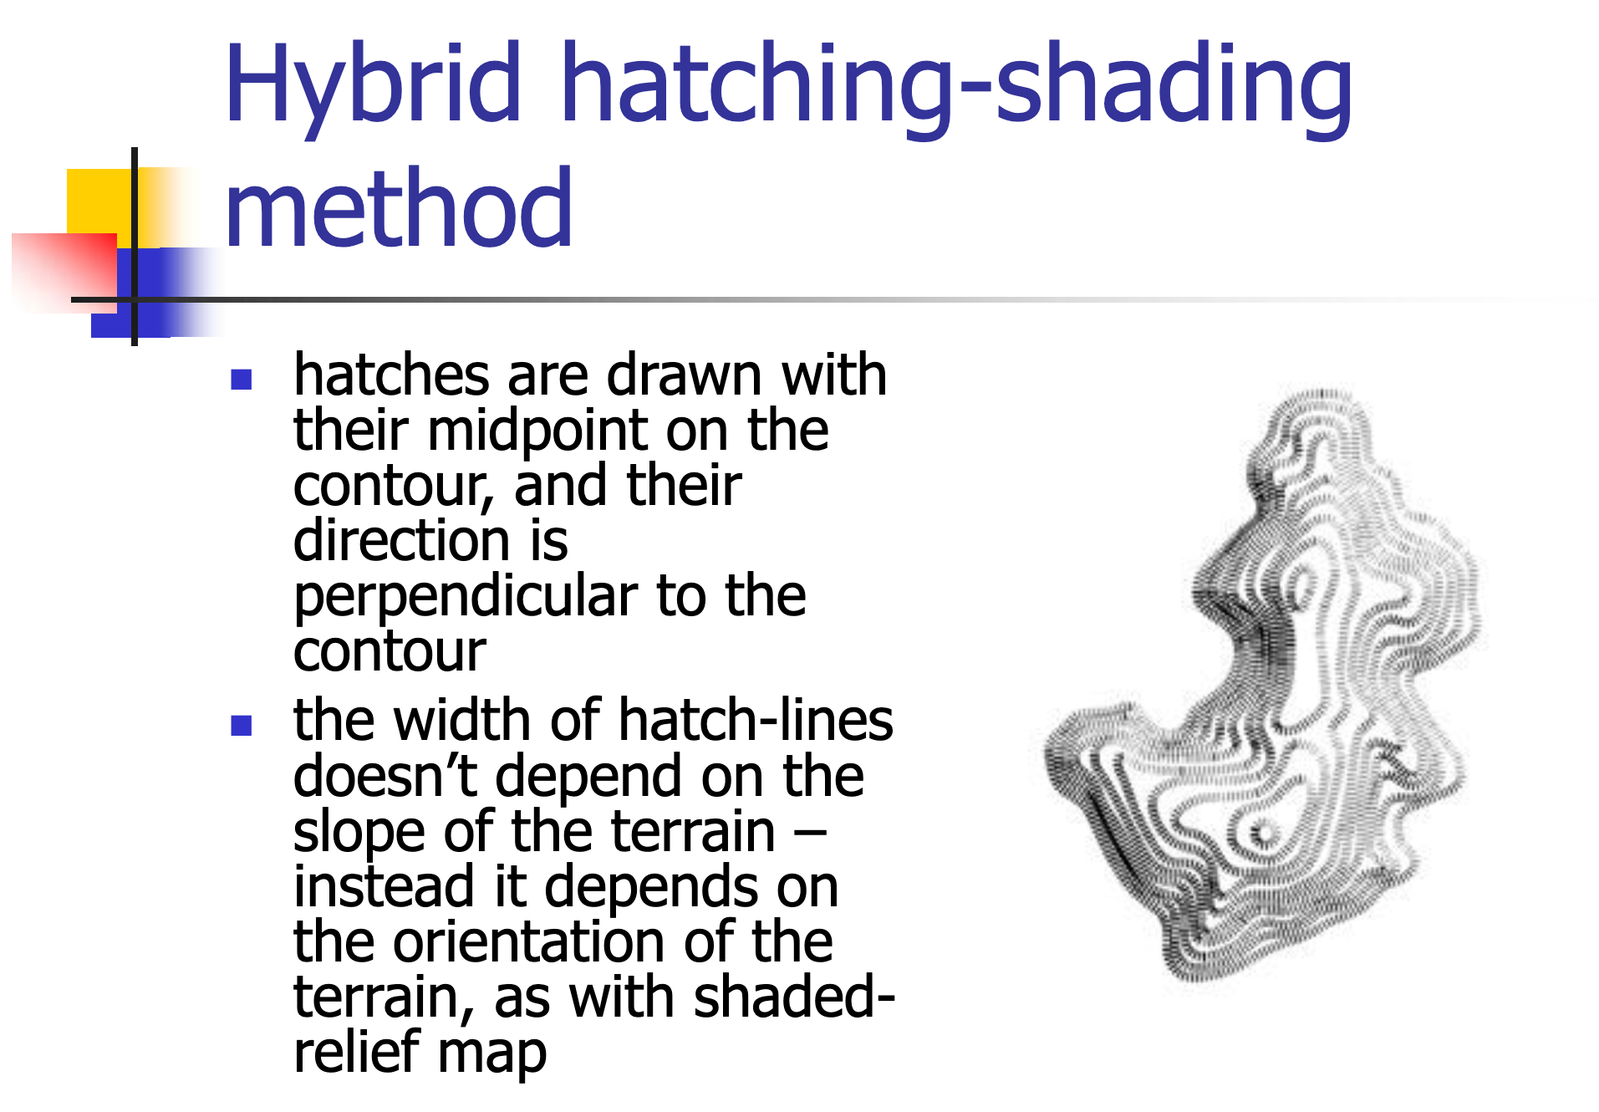
Hatching lines in combination with contour lines may make sense as well, as presented by Marjan Sikora:
Streamline-based hatchings
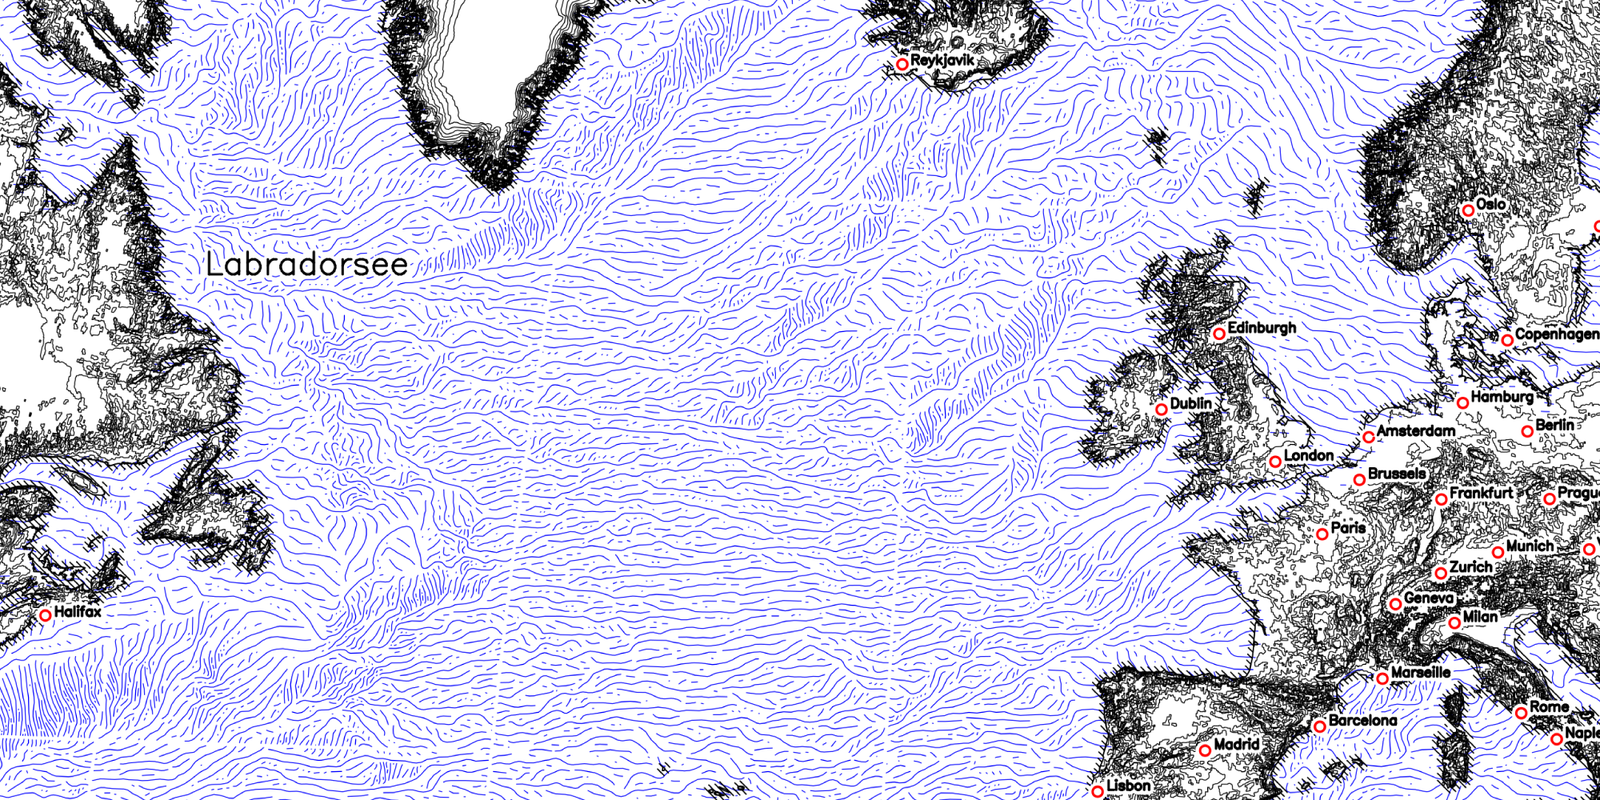 Using a Digital Elevation Model the angle and magnitude of elevation changes (basically the steepness of a slope and its direction) can be treated like a vector flow field. This allows to orient free-flowing hatching lines to align with the shape of the surface. The example above has been generated with my implementation of the algorithm in the paper Creating Evenly-Spaced Streamlines of Arbitrary Density by Bruno Jobard and Wilfrid Lefer.
Very similar results have been achieved by Daniel Huffmann in his projects.
In addition to that, there is a large body of work from the computer graphics community regarding hatching techniques and pen-drawing styles for 3d objects, but this would be out of scope for a short overview.
Resources, Links, Recommendations
- Cartographic Relief Presentation by Eduard Imhof is the book about creating maps
- Daniel P. Huffman is producing nice hatchings with his streamline technique
- The Swiss topographic map: Dufour map, also available via Wikimedia Commons
- Shading examples: shadedrelief.com, shadedreliefarchive.com, reliefshading.com
- The first pen-plotter map I did in 2021 using only basic hatching